At their best, data visualizations enable EdTech companies to tell interesting and meaningful stories using the data collected within individual products. Visualizations are both attractive and powerful. They have the ability to highlight trends, support decisions, and improve outcomes across the board.
But not all data visualizations are created equal. If you don’t approach them with focus and care, they can actually work against you. A data visualization can be gorgeous — a piece of art worthy of hanging on the wall — without being truly useful. Unless your users can derive meaningful insights from your data visualizations, they are nothing more than ornamentation. And if your data visualizations are all beauty and no brains, you throw out your data’s credibility and erode your users’ trust in the process.
Here’s what you need to know to produce data visualizations that are as relevant as they are visually appealing.
How to Tell Meaningful Stories with Data Visualization
So how can you make sure your data visualization is telling the right story? Keep these best practices in mind as you’re selecting a design.
Choose the right visualization for your data
Certain visualization types, such as radial and donut charts, are trendier than others because they are visually interesting. The trouble with selecting visualizations based on aesthetics is that you risk producing data visualizations that are more eye-catching than informative. The truth is that each type of chart has its own strengths and weaknesses. For example, donut charts and pie charts aren’t great at communicating totals. We humans aren’t very good at reading angles or areas. When you map data to angles and areas, it can be harder for people to accurately compare segments. Mapping the same totals to a bar chart may not be as sexy or interesting to look at — but it just might be more useful to your users.
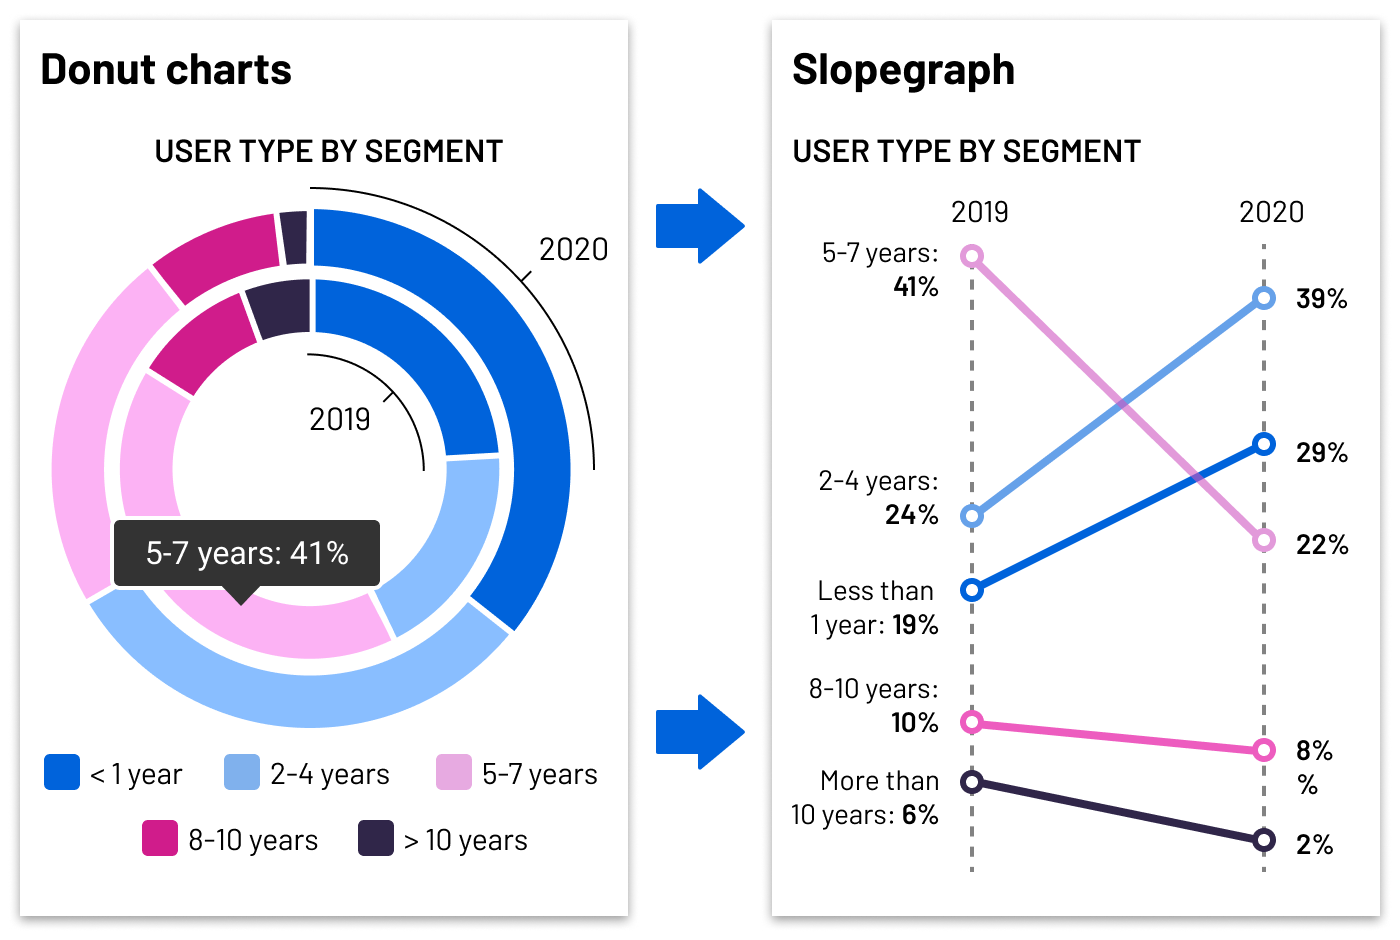
Donut charts are trendy but are best used sparingly, as it’s hard for users to compare arc length along the circle. Using more than one at a time compounds the problem. Something like a slopegraph makes the changes more visible. Directly labeling the lines on the chart helps with readability, too. There’s less cognitive load on the user, and you’re not hiding data behind a tooltip.
The takeaway? Rather than selecting the visualization that looks the most striking, make sure to select the chart that does the best job of meaningfully conveying your data to your audience. Ask yourself: What’s the point of your visualization? What do users want to do with it? Do they need to compare values? Or gain a quick understanding of basic up/down trends? The answers to those questions should determine the visualizations you use.
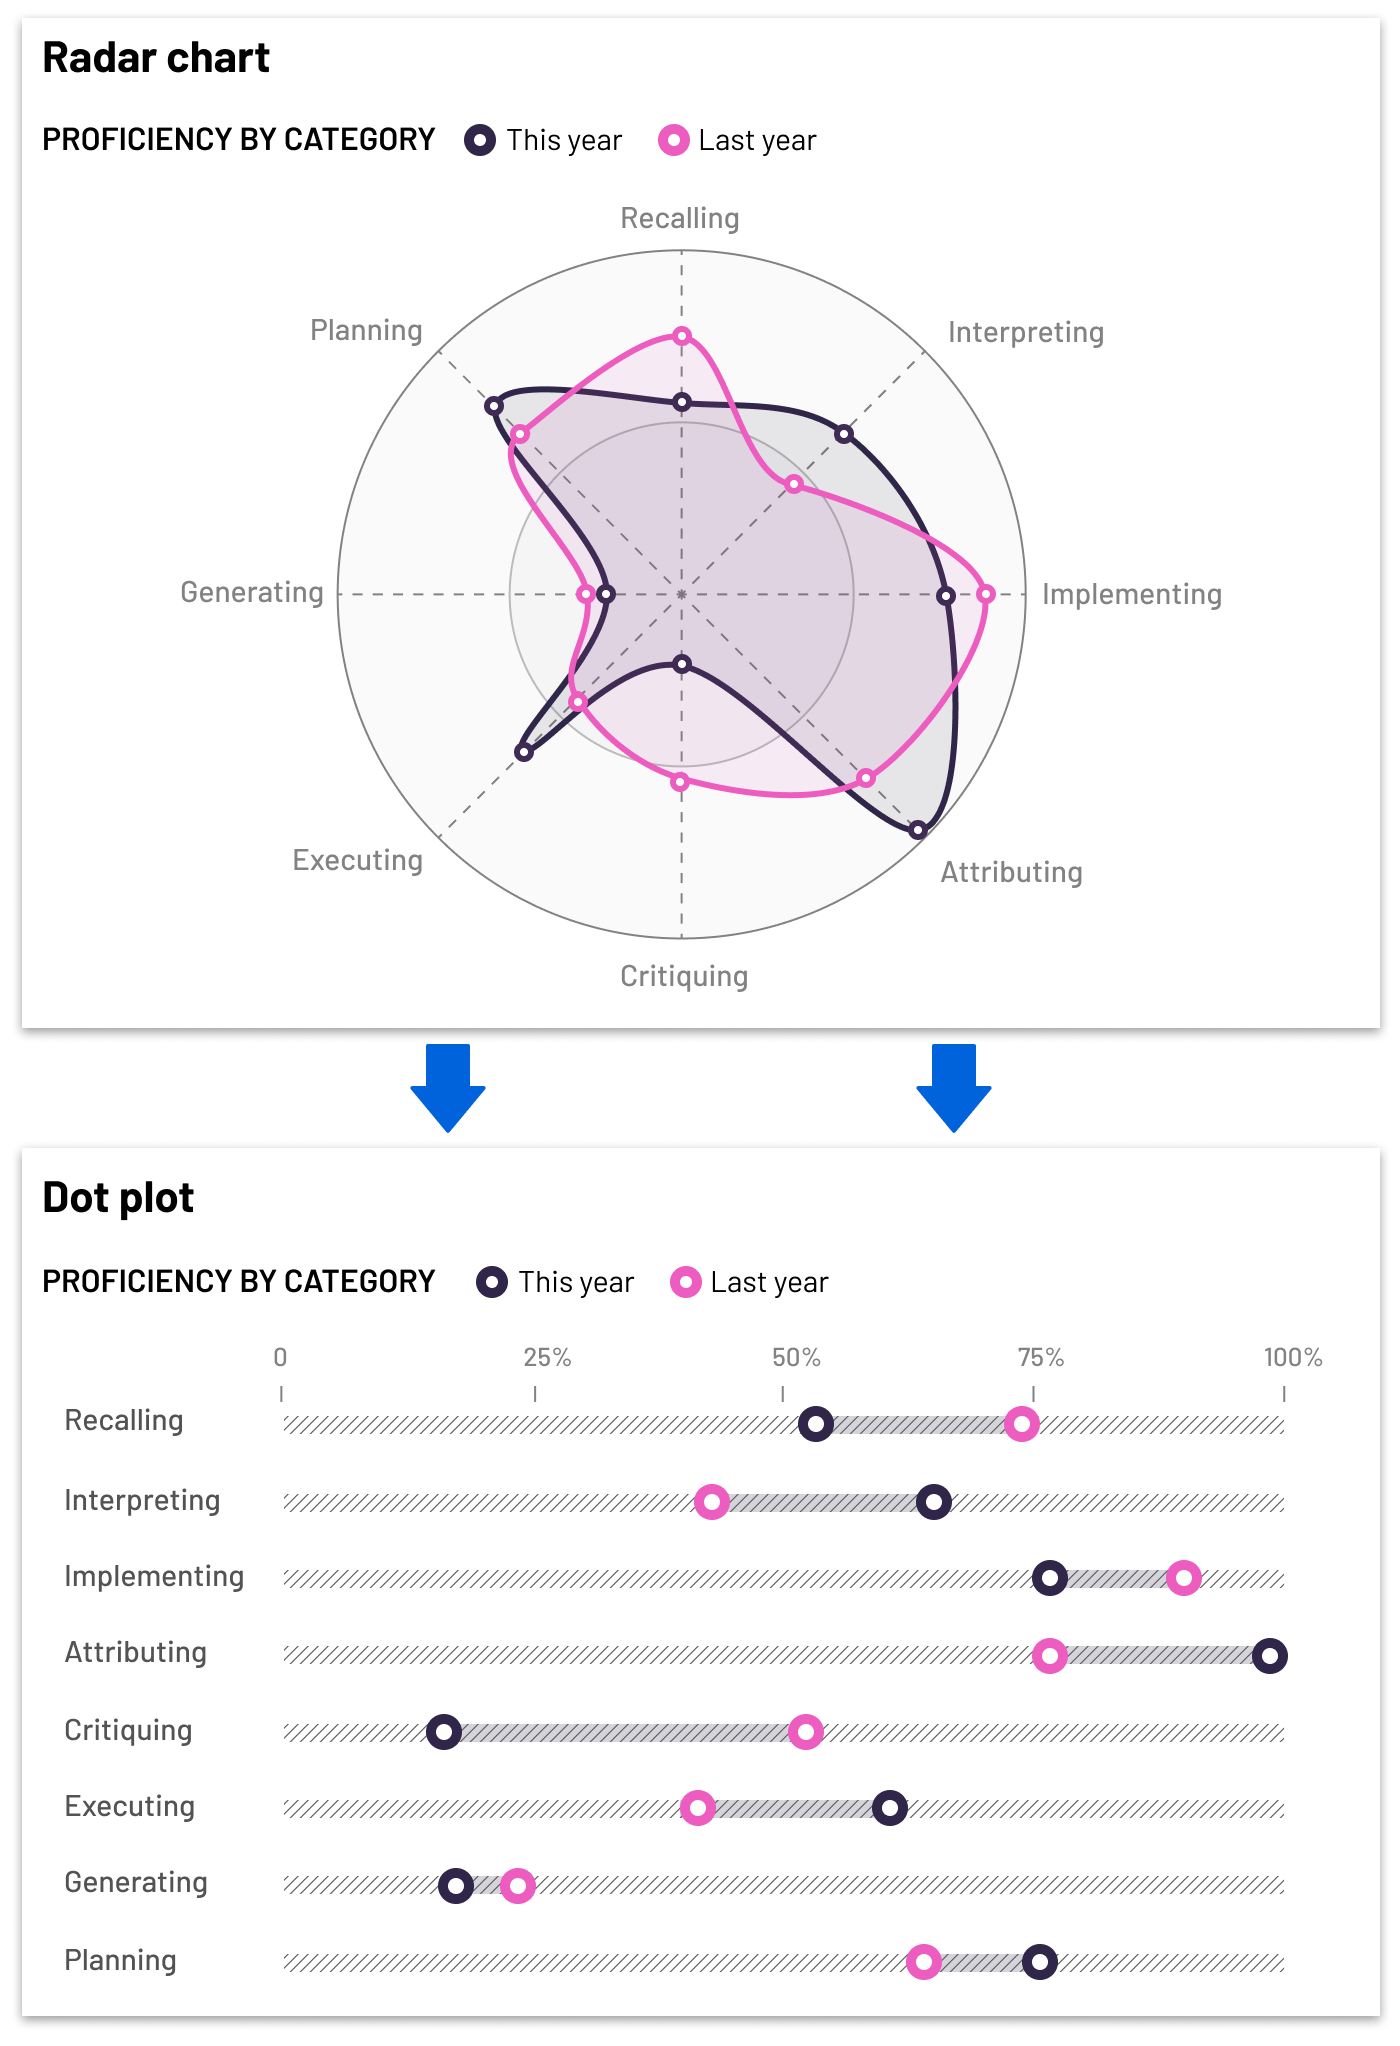
Radar charts also pop, but the data can be hard to make sense of. Try comparing the general locations of Metric 8 to Metric 6. It’s possible, but it takes a while. Plotting the same data on a chart where everything is on one axis lets the user more easily identify differences between categories.
Surface the right data at the right time
The placement of your data visualizations within your product is just as important as how you design the visualizations themselves. Remember, your data visualizations should appear to effortlessly surface the right data at the right time in your users’ journey.
Start by considering what action you want your users to take. How would data visualization aid them in achieving their objectives or making smarter decisions? What do they need to know at each point in their journey? Is a data visualization truly useful, or could you just as easily relay the information in a piece of text? By considering your users’ needs at various points in their journey (or in certain areas of your product), you can ensure that you use data visualizations to serve up the information they need most, right when they need it.
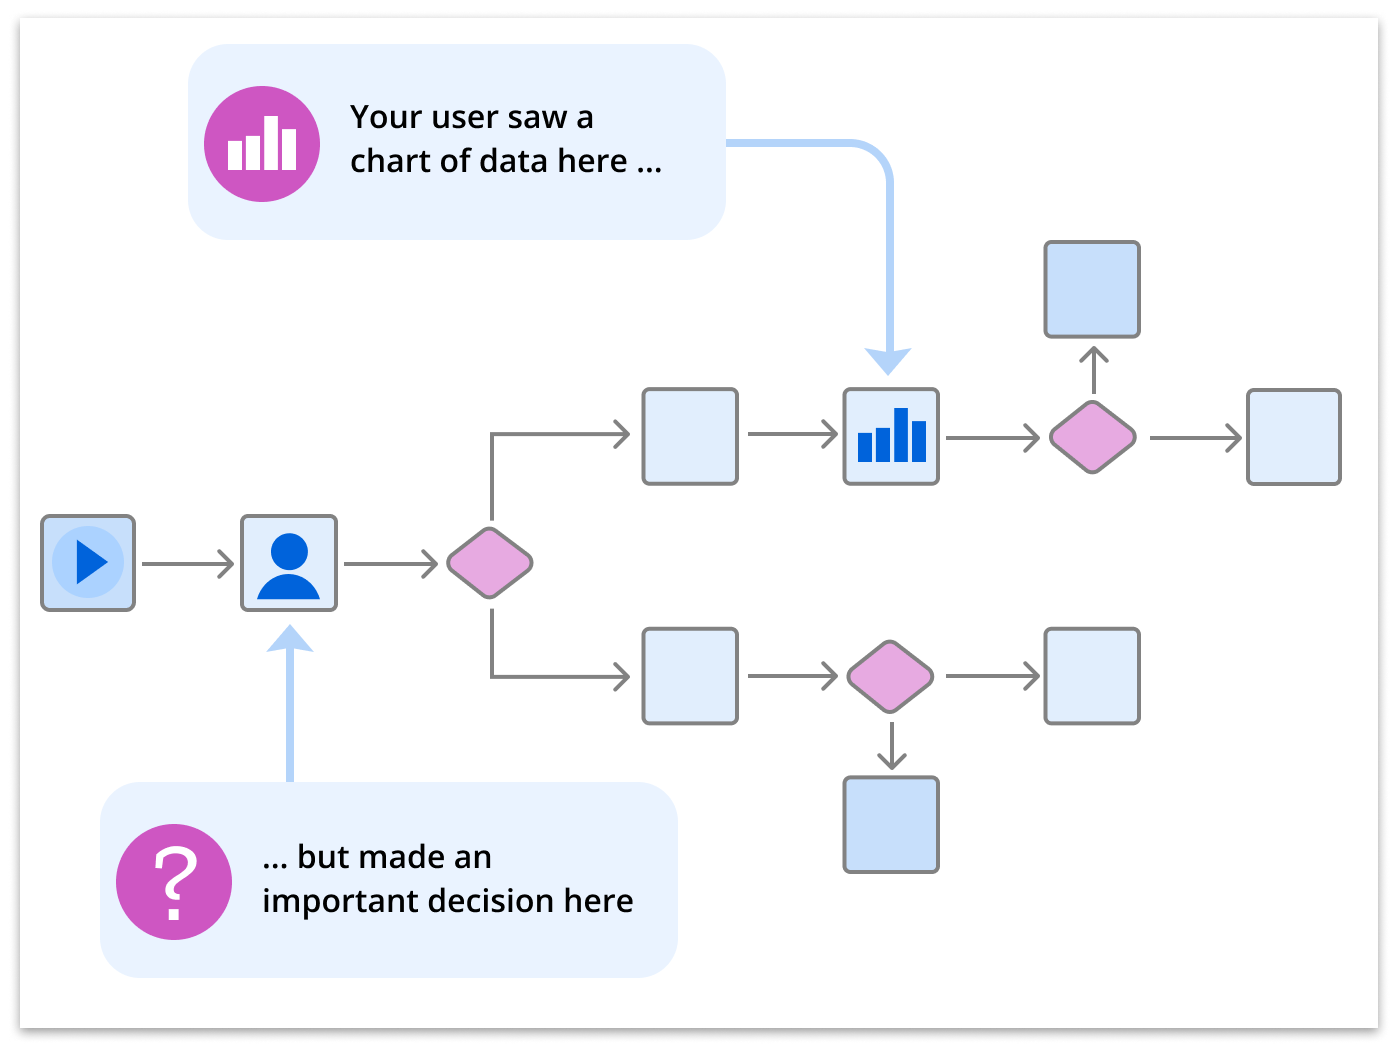
Visualizations are great for helping users make decisions, but they need to see them at the right time. A well designed chart is meaningless if it appears at the wrong point in a user flow.
Don’t ignore data’s context
A single data point doesn’t mean much when taken out of context. As you design each visualization, consider how much context is needed to provide meaning. The last thing you want is for your users to come away from your data visualization saying, “So what?”
Instead of showing a single number on its own, show where that number falls within a range — and what it means. For example, rather than simply reporting the average number of product users for the month, provide a clear indication of how the numbers are trending. How does this month’s average compare with last month and the month before that?
Remember, too, that the language you use to describe your data goes a long way in providing context. Resist the urge to whip out fancy statistical terms. Use language that is geared toward your users and their existing mental models. Make sure the terms you use in your data visualization match those in the product itself. For example, if you refer to students as “students” in your product, call them “students” (not “users”) in your administrative data visualization.
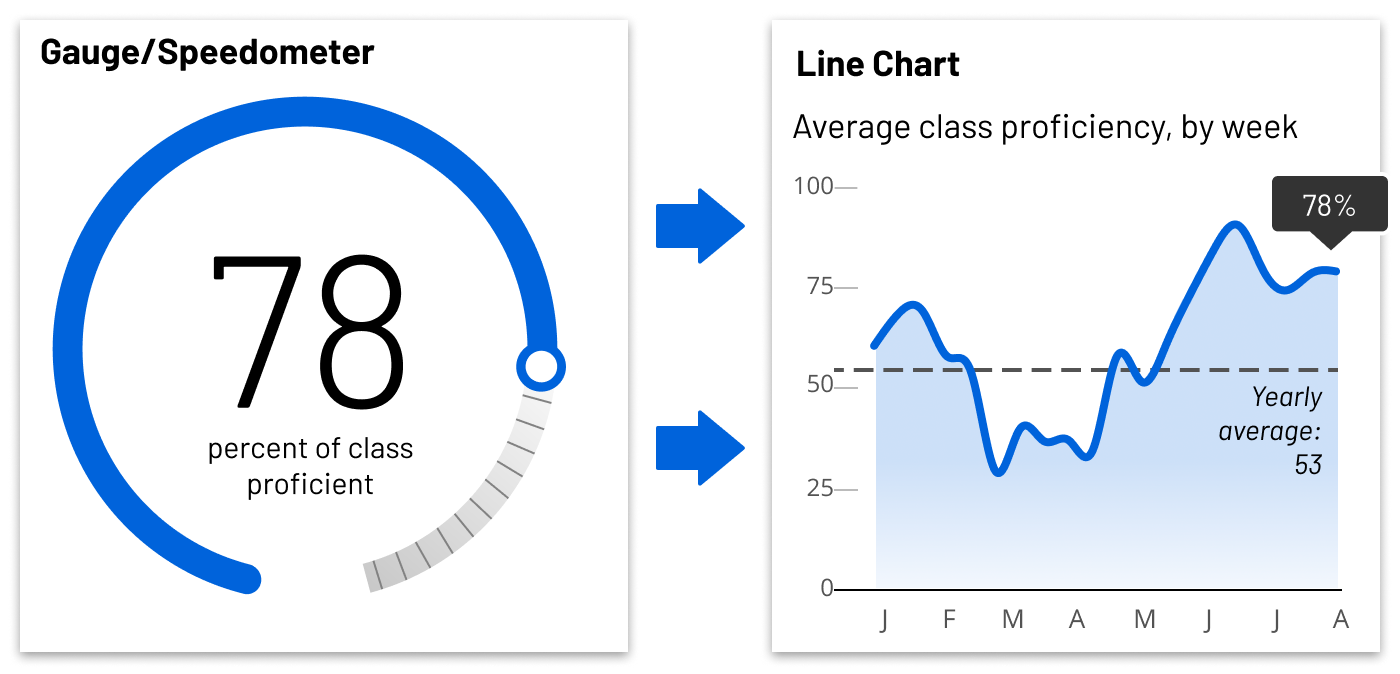
Don’t make the user say “So what?” when they see a chart. Is that number up or down? How does it compare to the overall trends? Show how that data point fits into the pattern. The maximum, minimum or average measurements are useful things for the user to know.
Consider data literacy
Even the simplest data visualizations demand a certain level of data literacy on the part of your users. Just like reading, it’s a skill that not everyone has developed to the same degree. For example, some people don’t know how to accurately read a scatter plot chart. If your data calls for a more advanced visualization, make sure to include enough guidance for your users to make sense of it. Effective onboarding can help with this.
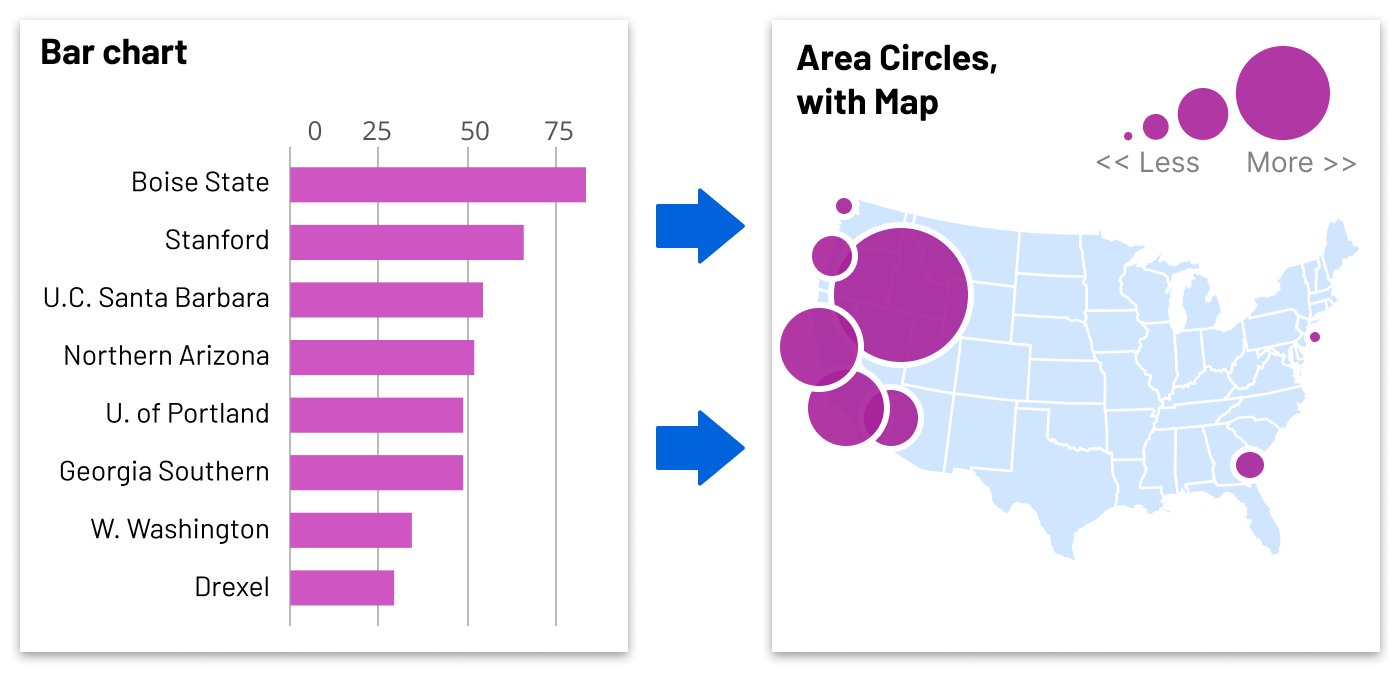
Bar charts are usually a foolproof visualization for most data, but they can be one-dimensional. Adding another dimension – such as location – can reveal hidden patterns in the data.
Make sure your data visualization is accessible — to everyone
A data visualization is an inherently visual artifact. It naturally assumes the user’s ability to consume information, well, visually. Of course, you know that’s not true across the board. Which means you must take pains to present the data so that it is accessible to users with disabilities. The good news is that there are several things you can do to help.
To begin, make sure you optimize your data visualization’s design for users with low vision and color blindness. To that end, plan to follow all Web Content Accessibility Guidelines (WCAG 2.1) related to visual impairments. For example, you should make sure to avoid using too many colors and ensure that the contrast between colors is high enough. Colors should also not be the only thing that differentiates meaning between data points.
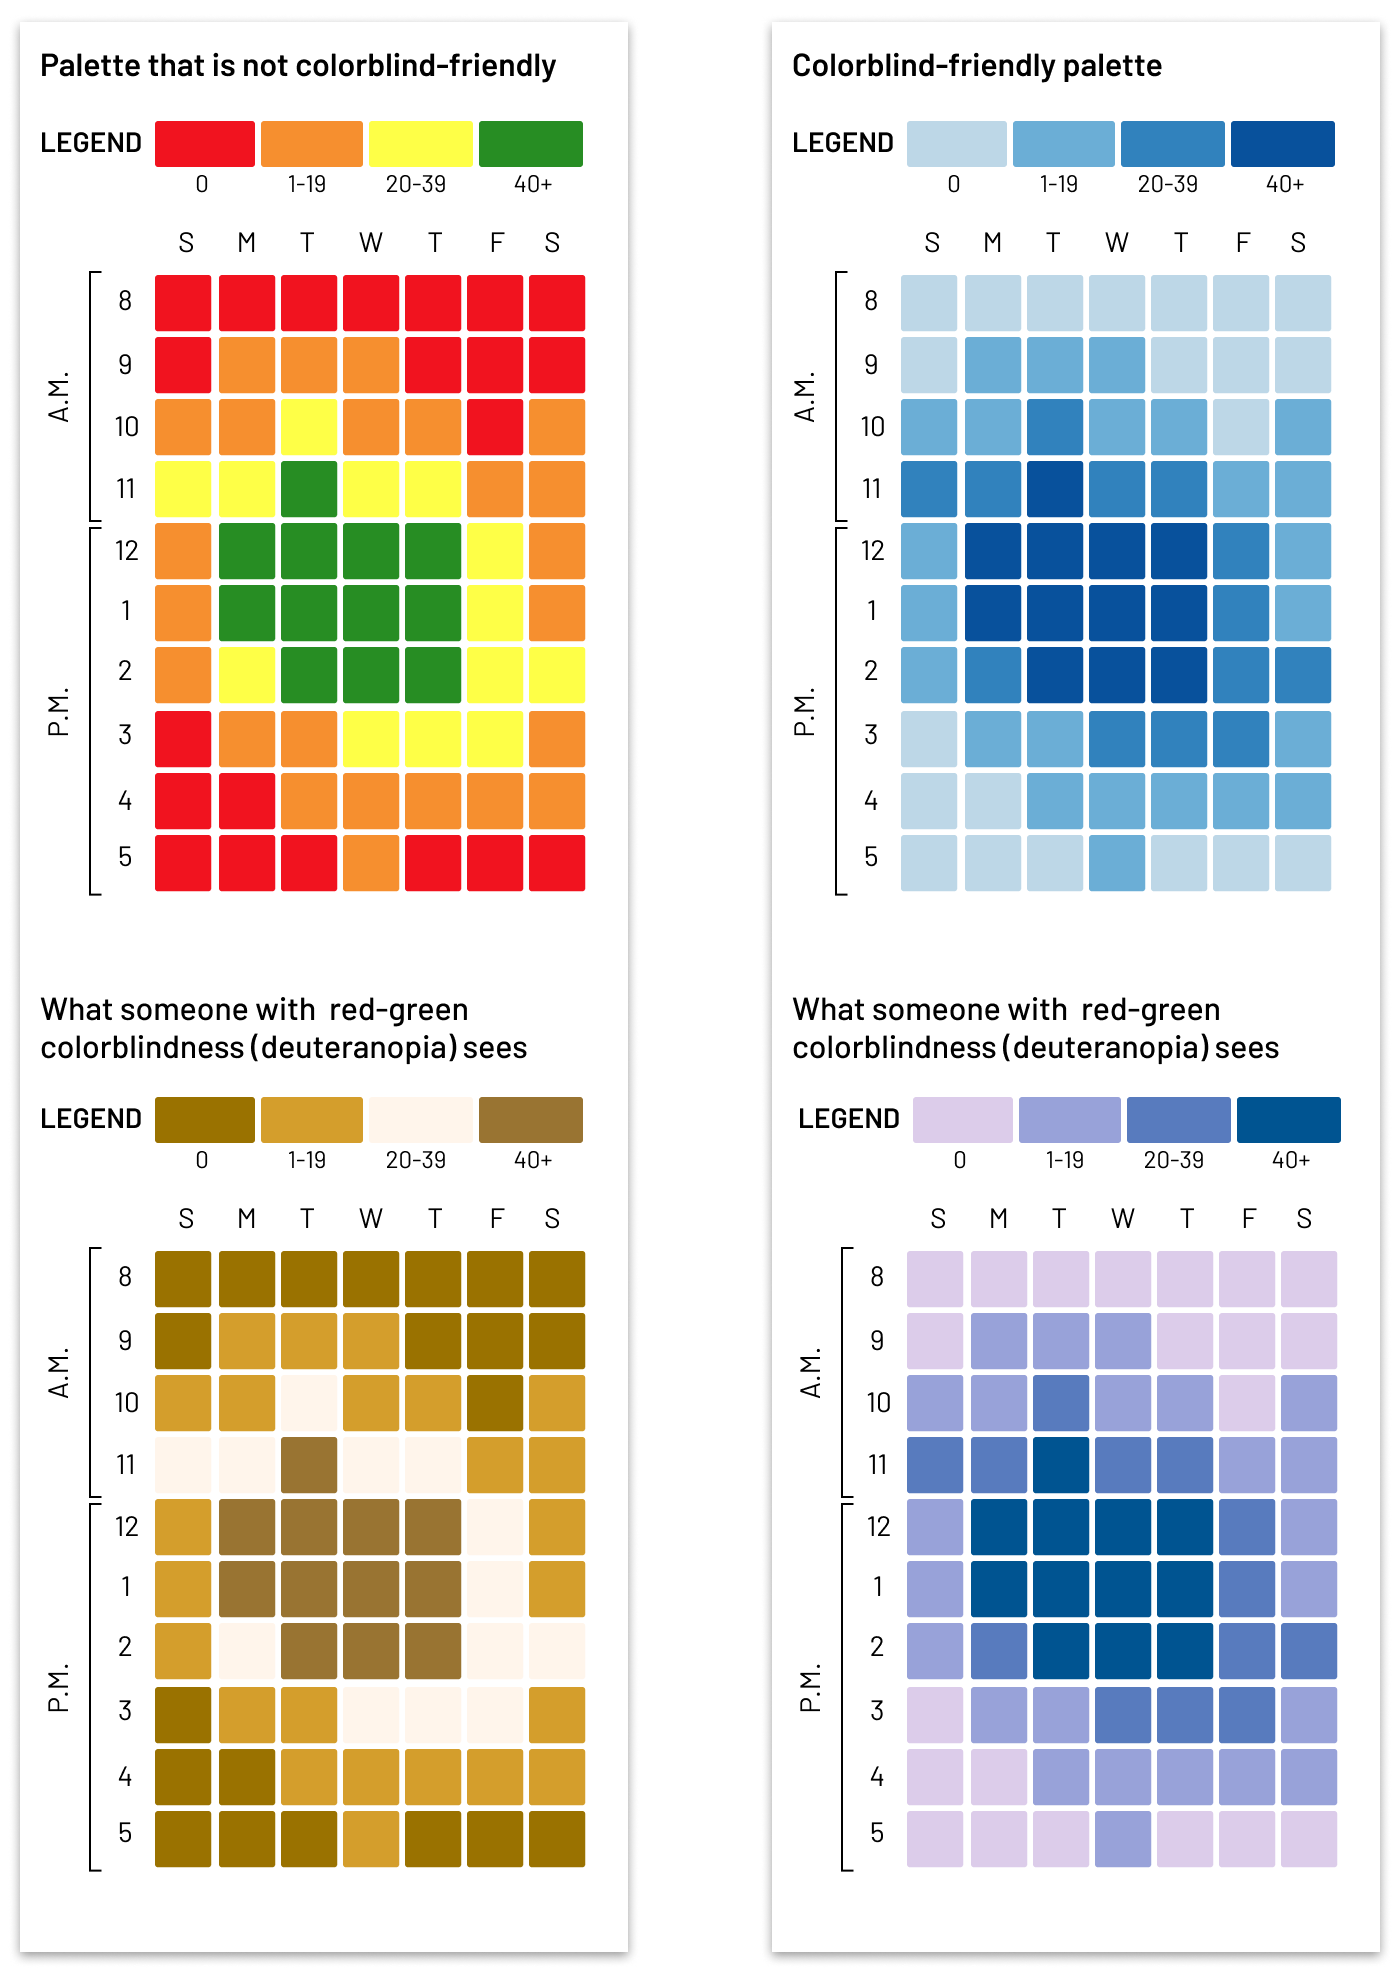
Users with color blindness should be taken into account when selecting color palettes for your data visualizations. Red-green color blindness is one of the most common. Instead of using different colors for classification, try using a single color with different values.
Your efforts to make your data visualizations fully accessible will include some back-end considerations, too. Make sure users can magnify images until they are very large (for those with low vision) and that your entire data visualization is navigable by keyboard (for users without a mouse). And avoid hiding key elements or data points behind hover states or other interactions.
Whatever you do, don’t forget to include rich, meaningful alt text for screen readers. Your goal is to give users with screen readers the same useful takeaways as sighted users. Rather than saying something vague like “this is a chart,” describe the visualization in as much detail as is necessary to provide understanding. For example, you might say “This is a bar chart of users by day showing a 20% increase from May to June.” Consider including a link to your source data so that it is accessible to users with their own assistive technologies.
Data visualization is a powerful way to deliver actionable insights to your EdTech product users. With a little care and planning, you can ensure that your data visualizations add value — rather than erode trust.